
Infographics In The Classroom: A Primer
contributed by Pamela Rossow
If you are a K-12 teacher or a college professor, you may be searching for new ways to promote digital literacy in your classroom.
Or just plain literacy literacy, for that matter.
Infographics can be useful teaching tools as they use so many elements of traditional “teaching”: the writing process, research, and planning, all while combining digital and traditional text forms. What exactly are infographics?
Infographics are “graphic visual representations of information, data or knowledge intended to present complex information quickly and clearly”[i]. They may be thought of as picture graphs yet tend to be more interesting than your typical bar graph or pie chart.
What are infographics made up of?
Infographics 4 primary components:
Text Features: White Space, Font, Colors, Shapes, etc
Idea Organization: Cause-Effect, Chronological Order, Attributes & Characteristics, etc.
- Imagery: Symbolic images, shapes, etc., that clarify and support the infographic’s purpose
Research/Sources Cited: Citation of credible primary and secondary sources
How can I use infographics in the classroom?
First, check out our 46 tools to create infographics. What you decide to do with those tools depends on if you want to make them, read them, or repackage them as other media forms. In a literature or language class for example, you might:
introduce the protagonist of a story
talk about a character’s decision in literature
highlight an important event or the climax in a story
compare a book with a movie
discuss the historical setting of a book
preteach a new subject
present a new idea or topic
Infographics can be intriguing for e-learners because they are able to combine pictures with information in a creative format using bright colors. They might be used as supplements to lesson plans or as starting points to get class discussions started.
How can I make an infographic?
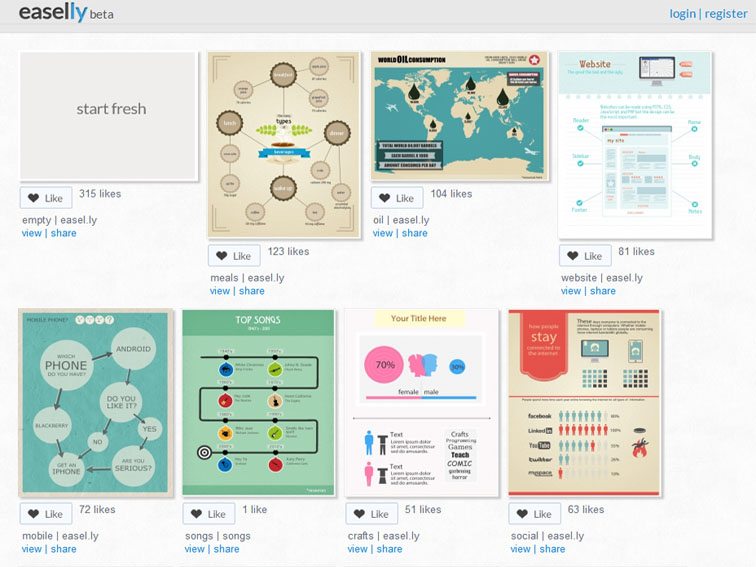
In addition to our list of tools above, you could use Mashable’s Pinterest board[ii] as a source of inspiration for your infographic. Piktochart and Easel.ly[iii] are great sites where you can make infographics. You just have to sign up, select a theme or a visual theme, and start creating in true drag-and-drop fashion. Other sites you might find helpful are Infogr.am, Venngage, or Visual.ly.
Creating infographics for use in the classroom may be an interesting way to grab your students’ attention, but like anything new, it won’t last unless you hand over the controls to them. Because there seems to be no limit to what you can imagine or create when it comes to infographics, students should be able to create, personalize, and publish infographics to suit a variety of authentic purposes.
[i] http://evasimkesyan.com/2013/06/28/using-infographics-in-language-classroom/
[ii] http://pinterest.com/mashable/infographics/
[iii] http://www.easel.ly/
Pamela Rossow is a freelance writer who works with higher education clients such as eLearners. She is a native South Floridian who enjoys photography, literature, and hockey.