
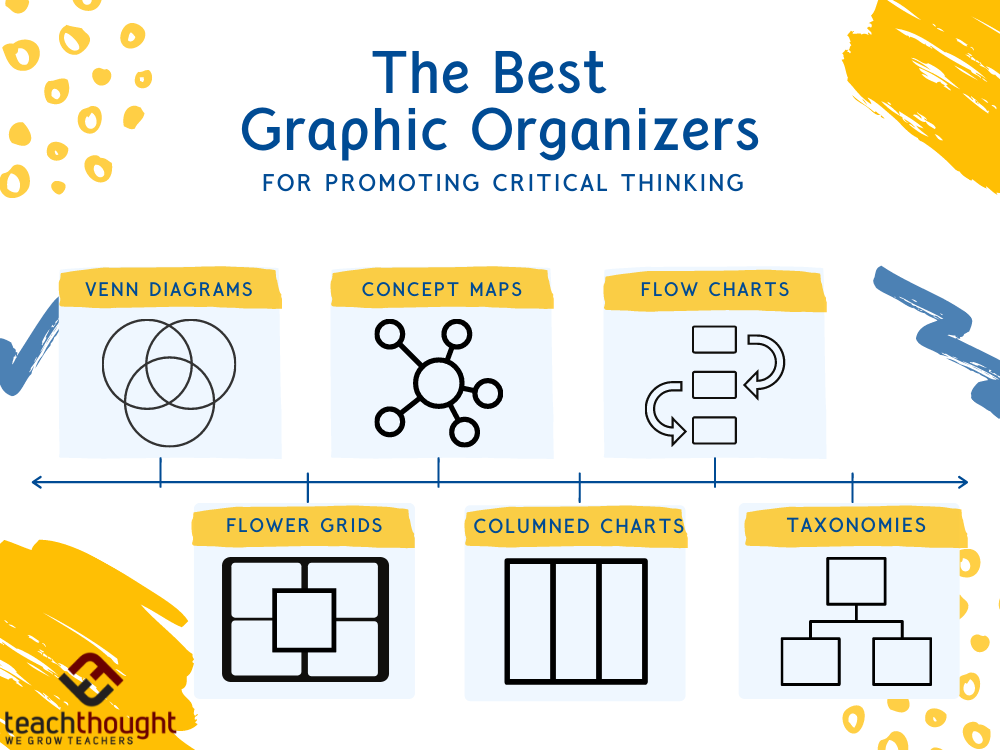
The Best Graphic Organizers For Promoting Critical Thinking?
Graphic organizers may be one of the most accessible, adaptable, and underrated tools for promoting critical thinking.
Think about it. They can be used for just about any purpose in the classroom, from note-taking, brainstorming, and making connections, to delegating responsibilities and reflecting upon one’s own thinking.
Evidence-Based Support for Using Graphic Organizers as Instructional Tools
The power of graphic organizers stems from dual coding theory, developed by psychology professor Allan Paivio in 1971. Essentially, Paivio suggests that our minds operate with two classes of ‘codes’ — mental images and verbal representations — and that our memory has two ‘storage facilities’ for these codes. While they are housed independently, they do interact with one another. Paivio’s central claim is that we are more likely to retain new information in our memory (and consistently retrieve it later), if it is stored in both the verbal and visual locations of the brain.
While there are certainly limitations to dual coding theory, countless studies have provided evidence to back Paivio’s claim, and dual coding is taught in teacher education programs across the globe.
See also The Definition Of Critical Thinking
So what does dual coding have to do with graphic organizers? Simply put, graphic organizers allow students to visualize, order, and categorize concepts using text (verbal representations) and drawings (images). Graphic organizers are also beneficial for breaking down complex or abstract concepts into more ‘bite-size,’ digestible ideas. Graphic organizers provide students with both structure and autonomy — they are given (or can create) a basic template, but they have the flexibility to be creative within that template. This balance of structure and autonomy is ideal for promoting self-directed, differentiated learning.
How are Graphic Organizers Useful?
Research shows that graphic organizers are a useful strategy for GT and SPED populations, but really, all students can benefit from the multimodal learning that graphic organizers support. Graphic organizers are highly versatile. Students can draw them, digitize them, or adapt a teacher-designed template. They are useful at any grade level and within any subject area for tasks like:
- Comparing and contrasting
- Narrating a sequence of events
- Exploring solutions to a problem
- Identifying relationships (like cause-and-effect)
- Brainstorming ideas
- Connecting previous knowledge to new information
We’ve searched the web for the most common types of graphic organizers and used our own categorizing system for how to present the best templates to you in the way that is most useful for your everyday instruction. Below, we’ve listed the 6 most common types of graphic organizers. With each type, we’ve shared an overall purpose and specific examples that you can adapt for your own lessons. We conclude by offering several important tips for using graphic organizers in the classroom, and providing links to some of the best online tools for creating and sharing graphic organizers online.
The 6 Most Common Types of Graphic Organizers
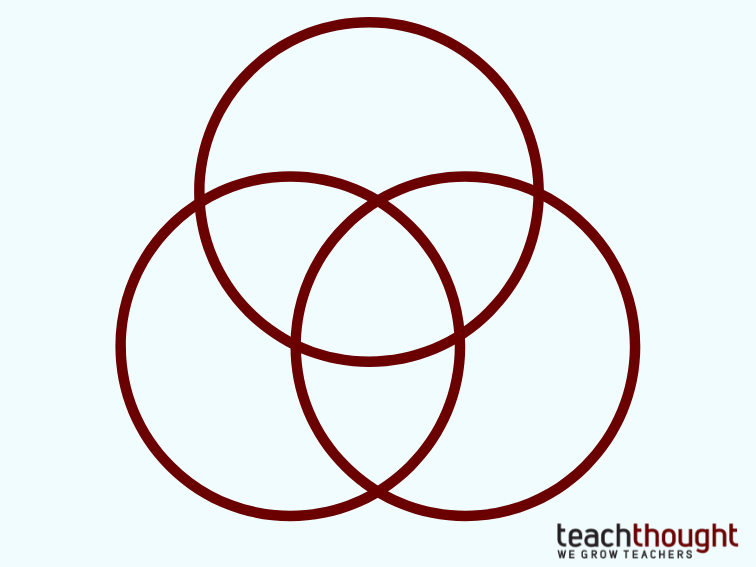
Venn Diagrams
Venn diagrams are probably one of the first graphic organizers that students are introduced to. Easy to create and easy to navigate, Venn diagrams are best used for comparing and contrasting. Typically, Venn diagrams appear in the form of two to three overlapping circles, where the overlapping segments provide space for students to take note of similarities, and the non-overlapping segments are dedicated for unique differences.
Venn diagrams might be used to compare historical events, monarch ‘ruling’ styles, nutritional value of foods, or important facts about planets in the solar system. Students can use words, phrases, bulleted items, complete sentences, and quotes as verbal representations, along with drawings, symbols, signs, photographs, GIFs, and videos as images.
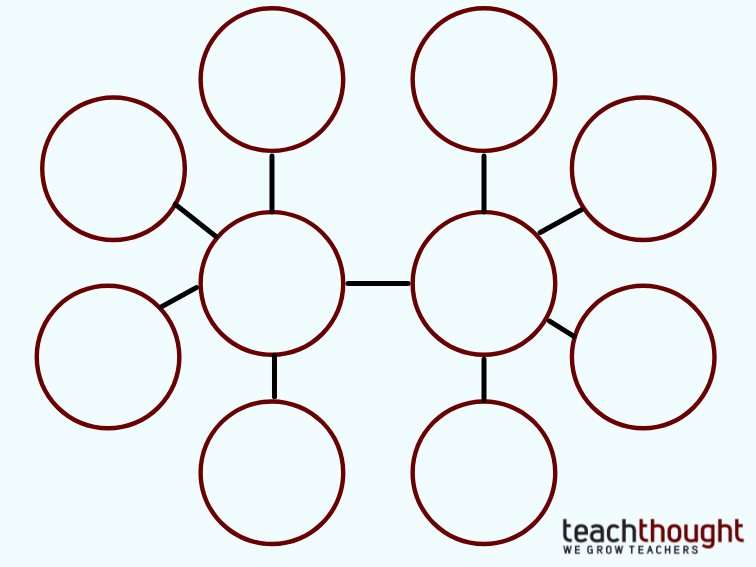
Concept Maps
Put simply, concept maps allow a creator to fully flesh out an idea. They typically start out with a center ‘bubble,’ then use lines or arrows to show relationships to surrounding bubbles. More complex concept maps may have more than one central bubble, and make more than one connection from any one bubble to another.
Concept maps are ideal for brainstorming or showing relationships between concepts. For example, a student might perform a ‘topic blast’ to generate ideas for a personal narrative, in which they are assigned the task of retelling a childhood story through their adolescent point-of-view. In the center bubble, they might write “adventures,” and then branch out to surrounding bubbles, where they might write (or draw) the names of specific adventures they’ve been on, like hiking in a national park, ice fishing on a frozen lake, or going on a safari with their family. They can continue branching out to even more specific bubbles. For example, they could extend additional arrows out from the safari bubble to brainstorm the parts of that adventure that were especially thrilling, such as getting up close to a hippopotamus, having to survive several days without electricity, or watching a cheetah devour its prey.
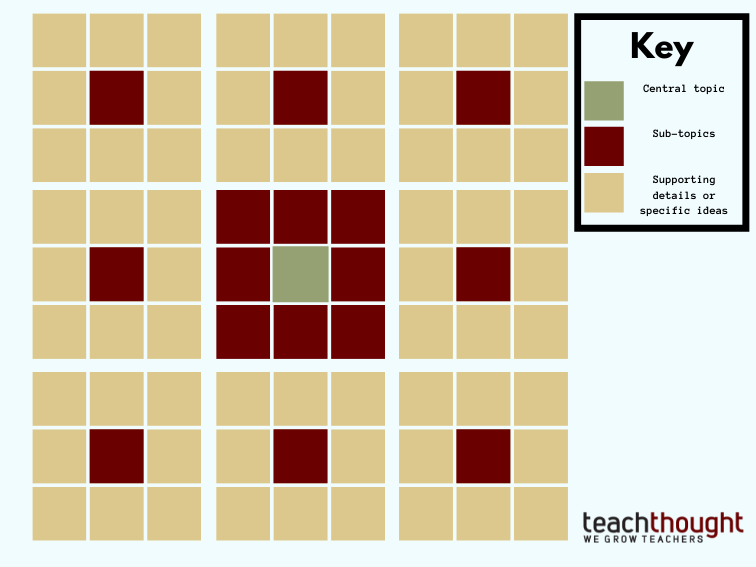
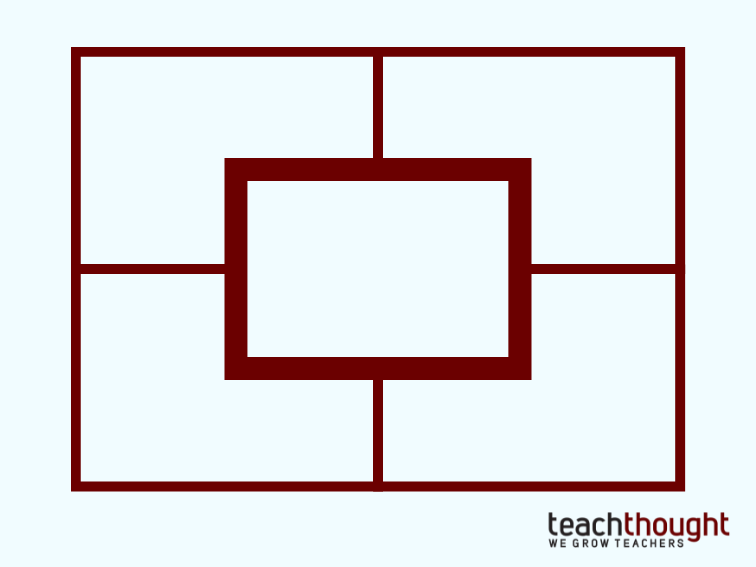
We’ve also seen a cool iteration of a concept map called a lotus grid. In this type of graphic organizer, there is a 3 x 3 grid with a main topic in the center-most square (the eight surrounding squares are sub-topics). Then, there are eight similar 3 x 3 grids surrounding the center 3 x 3 grid, with each one designated for exploring subtopics via facts, information, ideas, visuals, examples, etc.
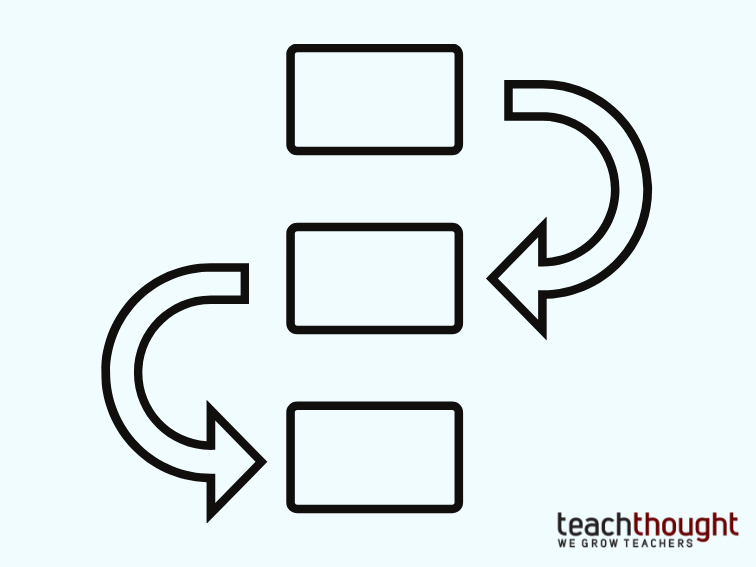
Flow Charts
Flow charts, timelines, storyboards…these are all different names for graphic organizers that perform a similar task: depicting a sequence of events or ideas. Flow charts can move from left to right, down to up, in an S-shape, or in a wheel — there are few limitations here.
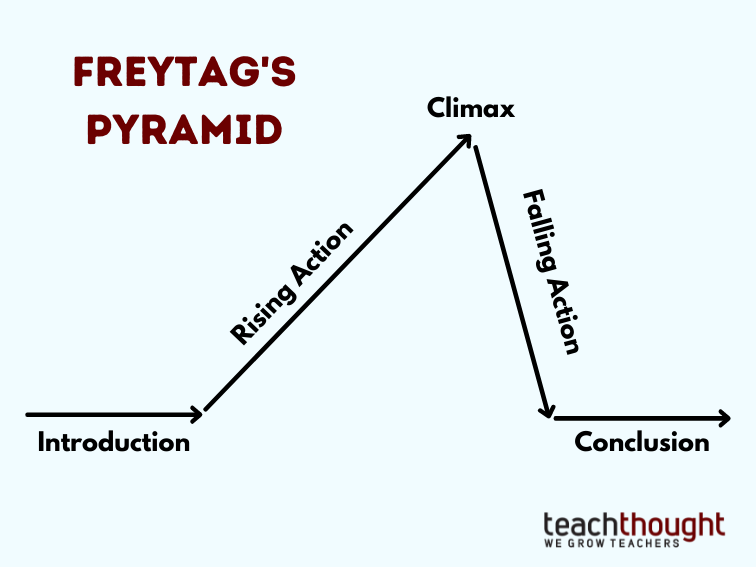
In teaching writing, we’ve seen flow charts used to help students organize paragraphs or entire essays. Freytag’s pyramid — a form of a flow chart — helps students diagram dramatic structure, starting with the exposition of a story, building suspense with rising action, reaching a turning point with the conflict at the climax, moving towards resolution with falling action, and ending with a conclusion. Using bubbles or extending lines, students can cite textual evidence that represents each plot point, draw images to represent a storyboard, or create symbols to depict historical events in a timeline.
Flower Grids
A flower grid is similar to a concept map graphic organizer, except it isn’t meant for showing relationships. In a flower grid, there is a center bubble, or ‘pistil,’ which is embedded among a group of outer bubbles, or ‘petals’ — like a flower! Instead of making connections to other concepts, a flower grid is best used to perform a ‘deep dive’ into a singular concept.
The most common use for flower grids is to explore a vocabulary word. The user might write a term in the pistil, and in the four surrounding petals, provide a definition, example of the word in a complete sentence, synonyms, and a visual representation.
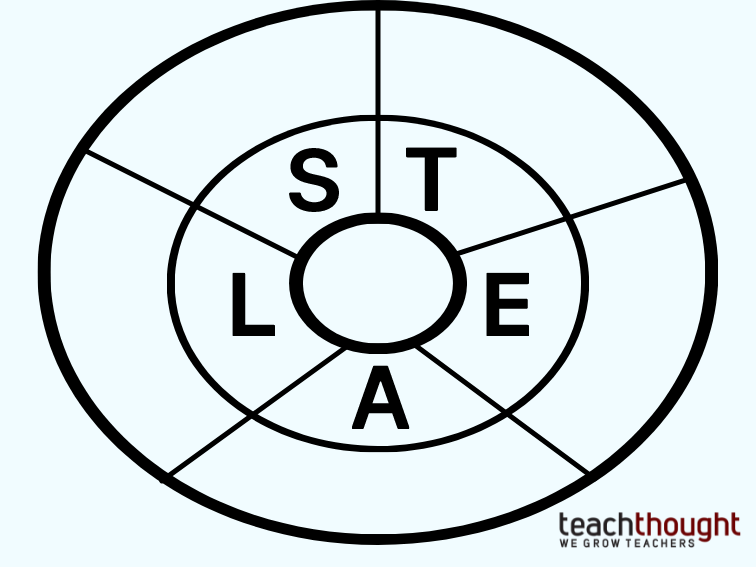
We’ve also seen flower grids used as STEAL charts for characterization. STEAL is an acronym for what a character says, what a character thinks, the effects a character has on other characters, how the character acts, and how the character looks. In a STEAL chart, the character’s name and/or picture is drawn in the pistil — it is surrounded by an oval divided into five segments, which is then surrounded by an additional oval divided into five segments. In the innermost oval, each segment is dedicated to a letter — S, T, E, A, and L. In each segment, the student can write textual evidence of each element of characterization. Next, in the outermost oval, the student writes their own interpretations for what the textual evidence means.
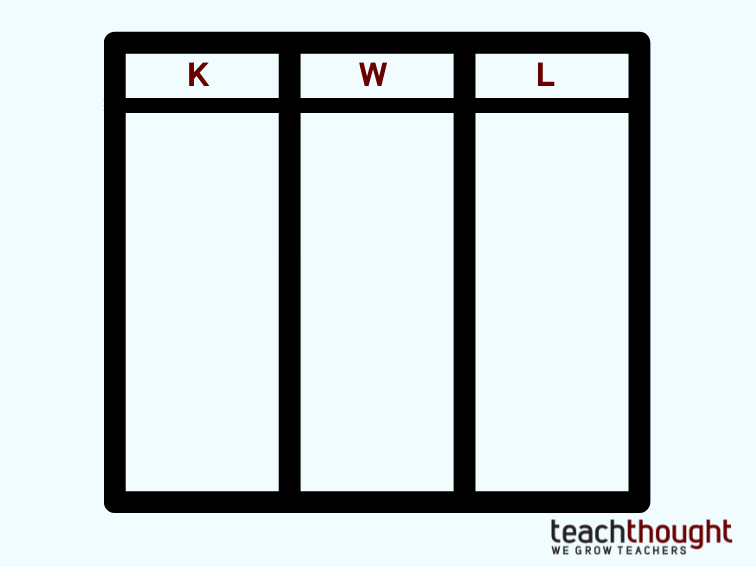
Columned Charts
Ah, old reliable. The 2-column chart (also known as the T-chart) and its second cousins, the 3-column chart, 4-column chart, and so on. What purpose do columned charts not fulfill? They can be used for examining pros vs. cons, similarities vs. differences, causes and effects, claims vs. evidence (vs. significance), and what a character says vs. what they actually mean. They’re ideal for crafting analogies, taking notes, giving peer feedback, and making connections to prior learning.
The KWL chart is one particularly useful 3-column chart that students can return to before, during, and after instruction. When being introduced to a new topic, students write down what they already know about the topic under the K column. In the W column, they jot down what they may want to know about a topic. Finally, in the L column, they reflect upon what they actually learned during instruction.
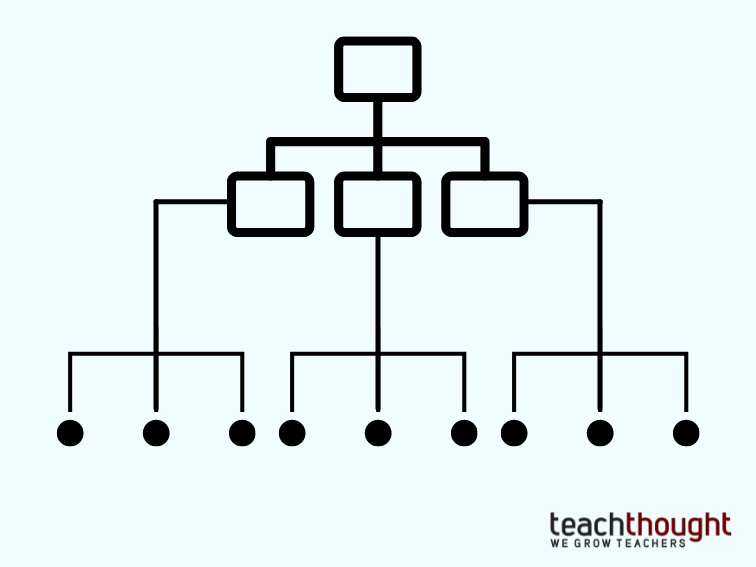
Taxonomies
Best suited for categorization and identifying relationships, taxonomies can be used to illustrate hierarchies and designate responsibilities. Typically, the most important (or central) role is at the top, and subsequent bubbles stem downward, indicating a possible chain of command or biological taxonomy (i.e., domain, kingdom, phylum, class, order, family, genus, species) or political taxonomy (i.e., making connections between the executive, legislative, and judicial branches, then listing each of their responsibilities). Taxonomies are excellent tools for group collaboration, where students can record responsibilities under each student’s name.
Teachers might use taxonomies to promote critical thinking. For example, they might give a small group of students a pack of 30 index cards with different terms or descriptors written on each one, then give the groups a certain amount of time to create a taxonomy or hierarchy.
Make The Most of Graphic Organizers With These Important Tips
While some students may be able to take any form of graphic organizer and run with it, teachers should model how to use a graphic organizer for any given assignment, or at least suggest different graphic organizers that might be conducive for an assigned task. The teacher can use a document camera to model his/her own thinking, or call upon a student to model the graphic organizer while the teacher adds commentary.
The great thing about graphic organizers is that they are flexible vs. rigid. Best used in the beginning stages of guided or independent practice, they can serve as effective formative assessments or checks for understanding; however, there are rare cases where they should be graded as summative assessments.
If you do decide to grade a graphic organizer, strongly consider relaxing expectations on structure and conventions. It usually does not make sense for a student to fill bubbles with complete sentences. For one, there just isn’t that much room. Second, graphic organizers are meant to be a little ‘messy.’ They’re essentially a visual representation of a student’s thinking, which is not always linear or obvious to an observer’s view. Now is not the time to worry about spelling, capitalization, and punctuation. The ideas are the important piece.
Finally, graphic organizers can be differentiated for various student populations. One group might receive a blank graphic organizer, while another group might get a graphic organizer with one example, and yet another group may receive a graphic organizer that is mostly done and acts as ‘guided notes.’ Consider having students share their thinking from graphic organizers with one another, and encourage them to synthesize insights from others into their own graphic organizers.
The Best Tools for Creating, Sharing, and Adapting Graphic Organizers Online
There are a variety of digital tools geared toward designing graphic organizers. We’ve included several of the most popular ones below:
- bubbl.us
- Mindmeister
- MURAL
- Conceptboard
- Padlet
- StoryboardThat
- Vengage
- Canva
- Lucidchart
- Piktochart
- Google Draw