

How To Use Infographics To Teach Classic Literature
contributed by Dawn Casey-Rowe for easel.ly
If you’re the English teacher or drama coach, you’re probably pretty up on your Hamlet and MacBeth. The rest of us–not so much.
These works can be pretty daunting for students and mere mortals alike. Even with Sparknotes, Thugnotes, and reading Amazon reviews, the classics are tough to understand. They’re classics for a reason. Students benefit when they understand the timeless themes and masterful writing gifted to us in these works.
“That’s just like…” Every time I assign reading that resonates with students, one or two will hang out after class and discuss similar situations in their lives. They find modern applications for the classics when they understand elements of the story. They become storytellers and future writers themselves, seeing that modern-day novels and blockbusters like The Hunger Games are brilliantly repurposed themes from classics like George Orwell’s 1984 and William Golding’s Lord of the Flies.
Writing and storytelling have never been more critical, according to Robert McKee, the author of “Story” and instructor to the stars. McKee feels there is a drought of ‘story’ these days, so it’s critical we study the craft.
The way students experience literature is changing. Web writing, advertising, YouTube, Snapchat, and TikTok are condensing the story, and short pieces dot the student landscape. Students must be able to learn the elements of “story,” in order to create universal pieces, whatever their medium.
Whether they’re reading, predicting, or decoding a piece of classical literature or writing and producing short bits for their YouTube channels, the craft of a story is critical. Good stories have universal themes that can apply anywhere with the swipe of a pen. They draw the reader in and evoke surprise. They make the reader say, “Wow…that could’ve been me.” These themes are what we experience when we read great literature.
Understanding the classics on many levels increases written and cultural literacy, helps students dive more deeply into the human condition, teaches problem-solving, relationships, and interdisciplinary subject areas. Ultimately, students learn to tell a good story themselves.
Unfortunately, many students ask, “Can’t we just watch the movie?”
Here’s where visual learning comes in. Infographics help students decode the more difficult elements of the story so students can access the text better as they read.
“I thought infographics were about data. How can I use them in English or Language Arts?”
Last week’s infographic feature was all about data. We showed how even the youngest students can use infographics to represent, analyze, and decode data, layering on more complex levels of information as they master data skills.
The novel is all about relationships, patterns, and themes. All of this is data, too.
Characters, plot twists, events, story elements, and rising and falling action are all things that can be drawn, plotted, or represented in an infographic. Showcasing patterns and relationships is where infographics shine. The study of literature has all of these in abundance.
Ideas for using Infographics to teach novels and story:
Students can create, critique, and analyze elements of stories, relationships between characters, themes, events, and actions in the story using infographics. Students can use infographics as blueprints to work through stories and create stories of their own.
Lesson 1: Create an infographic of a story the class is studying.
Option One: You, the teacher, can create infographics in advance to prepare students. Create them to show the characters, plots, and elements of the story to give to students instead of notes. In this way, students have a visual model to reinforce what the class is learning.
Option Two: Give the class an infographic on all of the above elements, except removing the characters, plots, or elements, having students fill them in like a note outline as the class studies the story. In this way, students are piecing together the story as the plot emerges.
Option Three: Give each student or group of students one topic for which they will create and present an infographic to the class. This option allows students to take ownership of a complete area of research and analysis, practice skills in group work, and use public speaking skills in a presentation.
Lesson Two: Create an infographic tying the novel with other things.
Take any great novel, and you’ll be able to connect its themes and events with other fields. Have students use a novel you’re studying and create an infographic tying it in with each of the major subject areas. Students should find a relationship between the story and characters and modern-day news stories, mathematics application, physical education, music, science, technology, and careers. Have students clearly show how the plot, characters, and events in the story connect with all of these things–and more–in the outside world.
Lesson Three: An Infographic Assessment.
Create an infographic for any of the following, and have students supply the missing sections as an assessment. Students must be able to explain or defend the way they completed the infographic with evidence from the story. Use some or all of the following areas:
- Elements of story
- Story timeline of events
- Themes of multiple stories
- Relationships of characters
- Cause and effects.
Lesson Four: Pure fun.
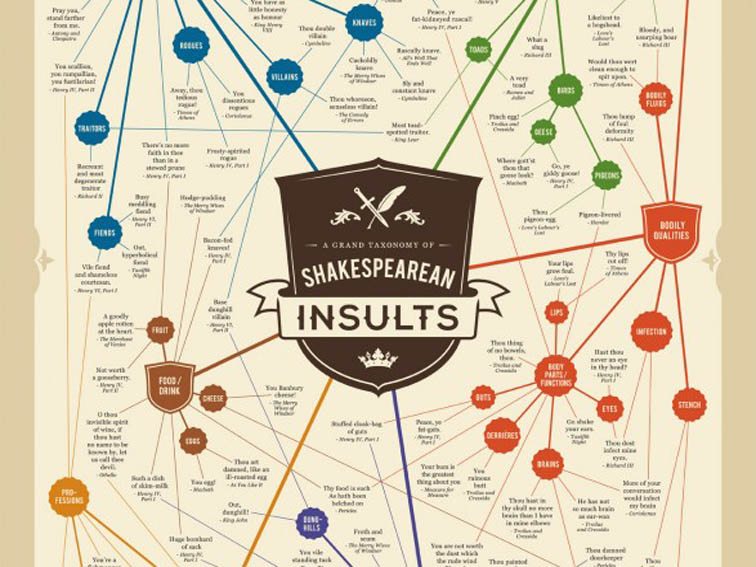
Have you ever studied the Shakespearean insult? Shakespeare’s characters had more wit than the modern-day ‘Yo Mama’ joke. Make an infographic–Rated PG please–showcasing some of the more biting Shakespeare retorts along with a modern-day equivalent.
Lesson Five: Villains in Literature.
If you’ve studied a lot of literature and you’re heading toward the end of the year, why not have a capstone assignment showing off all the villains from the major novels you’ve read. Or, if you’re a glass-half-full person, show the good guys, too.
How should I start?
There are endless ways to use infographics and visual learning in teaching literature. Try a few in your class today. You’ll be letting students express themselves while helping to create organizers and visuals that take complex subjects and break them down, making students love the classics they read.
Below are hand-drawn infographics. Art by Nicole Silvia. Both are amazingly beautiful, but even teachers without art chops can create beautiful graphics using technology today!