
Can You Cultivate Critical Thinking With Infographics?
contributed by Latasha Doyle
One of the most difficult aspects of teaching is ensuring that your students are actually evaluating the information, rather than just regurgitating it back to you.
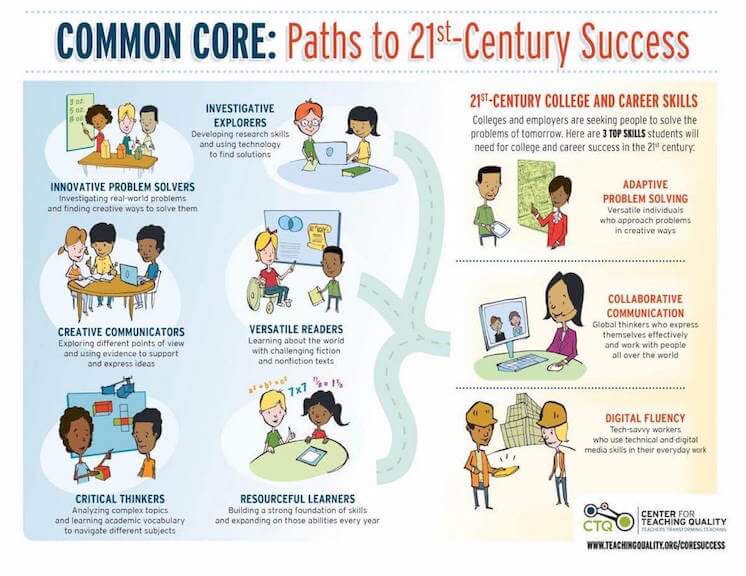
Critical thinking skills are incorporated into nearly every lesson plan now, especially with the implementation of Common Core State Standards (CCSS). But how do you ‘grade’ such a skill, and how do you give students the tools and resources to cultivate critical thinking?
Today, teachers are beginning to fully embrace visual learning as a way to help students incorporate critical thinking into every facet of their education. Visual learning has grown exponentially as technology has improved and access has spread. This makes it easier for teachers and students alike to create and use visuals to show, share, and interpret information in whole new ways.
Why Visuals?
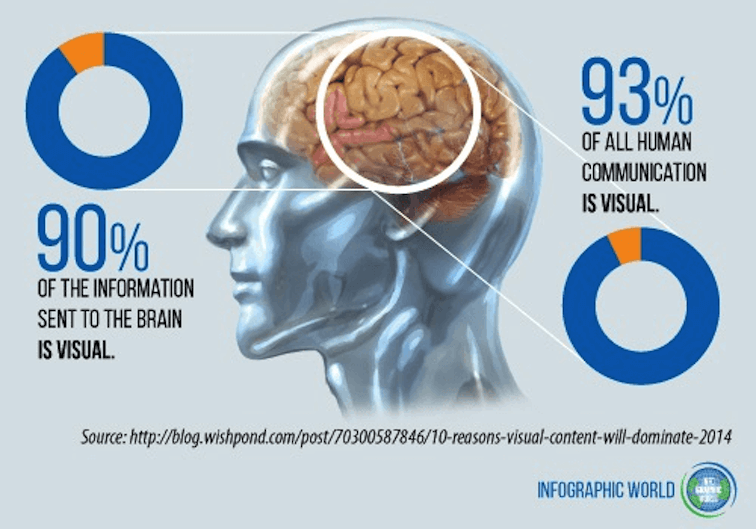
While the idea of ‘multiple intelligences’ dictating the ‘only way’ students learn hasn’t been proven, studies indicate that up to 65% of the population are visual learners (meaning they prefer and even excel when learning can be made visual) and numerous studies indicate people process visual input 60,000 times faster than anything read or heard. Because of this, visual aids are projected to increase learning by 400%. Of course, the value of visual learning has long been understood by any teacher worth his or her salt.
Teachers have drawn pictures on the chalkboard, created charts and diagrams, and given out worksheets that all have visual components for decades now. But now educational initiatives like CCSS have created ‘anchor standards’ to systematize the need for visuals in the classroom.
Visuals in CCSS
Common Core State Standards put a lot of stock in the power of visuals in education. In literacy, math, and other areas, the visual representation of information is considered a crucial aspect of measuring critical thinking. CCSS.ELA-Literacy. CCRA.R.7 states that students must be able to “integrate and evaluate content presented in diverse media and formats, including visually and quantitatively, as well as in words.” CCSS.ELA-Literacy.RH.6-8.7 require that students “integrate visual information (e.g., in charts, graphs, photographs, videos or maps) with other information in print and digital texts.”
In math, CCSS varies by grade, but the standards essentially require that students demonstrate their ability to visually represent mathematical ideas, formulas, or components. Students must also be able to interpret and define their visual representations.
CCSS is based on the idea that students should be able to ask questions and apply knowledge in unique ways. It is also designed to help students absorb information through a variety of sources and interpretations. But how can teachers accommodate these standards into their classroom without overwhelming themselves? Which visuals help students think critically? And how can teachers prove it quantifiably?
Cue infographics.
Infographics in the Classroom
An infographic is defined as a visual image used to represent information or data. Pretty simple, right? The beauty of infographics in education is that they are so versatile. You can use infographics in virtually every subject and every student is capable of learning from them in some capacity.
An infographic is different than just drawing a picture or finding an image that somehow embodies the lesson or information a student is learning. An infographic is way to ‘cut through the red tape’ of visual processing, and they are actually proven to improve retention.
When you use infographics in your classroom, you’re giving students the chance to process and interpret symbols faster than they could process what you write or what you say. (An image can be processed and assigned meaning in about 250ms). Depending on the age of your students, assigning a ‘picture value’ to a concept can help them absorb it faster than reading or listening. Our brains are wired to take information from our visual centers, after all.

You’ve probably used infographics in your own classroom, whether it’s a poster of the Nitrogen Cycle, an essay map, The Periodic Table, or a representation of a specific historical event. But in order for students to follow the standards of your state and district, they also need to show that they, too, can create visual representations of what they’re learning.
Because of this, infographics are seen as a twofold resource in the classroom: as a way to teach students specific material, and as a way for students to demonstrate and share their knowledge.
Getting Students to Use Infographics
We already know that infographics (visuals that represent data or a concept) are a really great way to teach material. But the real sticky learning comes when we allow students to create infographics themselves. Seeing information is powerful; creating the information yourself is game-changing.
When students have to take a collection of data and explore it visually, they’re going to remember about 80% of it. In ‘participatory lessons’ with infographics, your students could recall as much as 70% of what they learned 3 days later. Depending on the format of the infographic, as well as the subject, a student can “play with” information and mold it into a visual representation uniquely theirs. This helps them retain the information, as well as recall it and apply it later on.
Take, for example, a student who is told to create an infographic to highlight a specific math formula. Instead of rote memorization, that student gets to evaluate all the ways that specific formula can be applied, and will have visual cues from his or her infographic in his mind days, weeks, and maybe even years later.
The same goes for the student who has to create a timeline infographic out of a historical event. He or she is going to better understand the first events, the “domino effects” of the situation, and the specific dates, people, and places involved. Students can draw on these visuals come test time, and can even remember them as adults!
You’re probably thinking, “That’s great and all, but how do I get students to use infographics?” Odds are, they already are!
You can see it in 1st and 2nd grade classrooms, when they create charts to show the things they’ve counted. We see it with 4th and 5th grade students who have to draw a diagram of the states of water. Middle school teachers can use infographics to teach classic literature and high school students use them in presentations of historical events.
The only difference in any of these scenarios is the student’s level of current knowledge. Regardless of the age of your students, they can create images that display their understanding of the material. Using great infographic rubrics can help teachers objectively see how a student’s infographic measures up to CCSS, and also ensure that the graphic contains all the necessary information from the unit or lesson.
Infographics allow for the objective evaluation of complex processes like critical thinking. How many other tools in your teaching toolbox allow you to do that?
Infographics and EdTech
Another component to the Common Core standards is the need to incorporate technology – this is just another way that infographics shine. Students need to be able to: “integrate and evaluate information presented in diverse media and formats…” (CCSS.ELA-LITERACY.CCRA.SL.2) and “make strategic use of digital media and visual displays of data to express information and enhance understanding of presentations” (CCSS.ELA-LITERACY.CCRA.SL.5).
There are technology standards that come into play with technology, as well, but all fingers point to the same conclusion: We must support digital citizenship as an aspect of learning and critical thinking.
What does this mean for your classroom? It means that you and your students can create visuals, like infographics, using technology. It’s not as difficult as it sounds (for your students, at least). Infographic creation tools like Easel.ly have made infographics both simple to create and easy to access. You can also allow students to work in groups, have master access to their images, and share the graphics through downloads or share links.
These infographics can be used as part of a final project, or even a test review. They can be used to share new information with the class, or as part of a digital evaluation for CCSS. If you’re worried about teaching your students (of any age or grade) how to create their own infographics, let’s remind ourselves that they are digital natives. You can introduce infographics through a ‘Bring Your Own Device’ instruction day, or with Chromebooks or tablets in your classroom, or by booking a day in the computer lab.
Odds are, your students are going to learn how to use an infographic creation tool faster than you.