
What Does A Data Wall Look Like?
Preface: Data-driven instruction is becoming increasingly popular in outcomes-based and standards-driven learning environments. Data visualization, then, is by proximity going to become increasingly important: what fresh, relevant data looks like, and how it cane be packaged so that it is accessible and usable for teachers on a daily basis. So it was with this in mind that we found instructional coach Kasey Kiel’s post on her blog interesting. Her original post appears below.
by Kasey Kiel, Literacy Coach
A data wall unites a school by bringing a staff together to see students as “our students” versus his students or her students.
In our school, we use it to help identify students for reading interventions, to visualize common trends in data, and to set goals for where we want our students to be. We keep the data wall in the hallway that leads to our teacher’s lounge. It is not out in the open for students/parents to see.


This is the key for the data wall. Each student is represented by a different notecard. Each color of card represents a different grade level. We use the Fountas and Pinnell grade level expectations. It is a leveled continuum from A-Z that is measured by the Benchmark Assessment. We use students’ benchmark levels to work with students during guided reading.


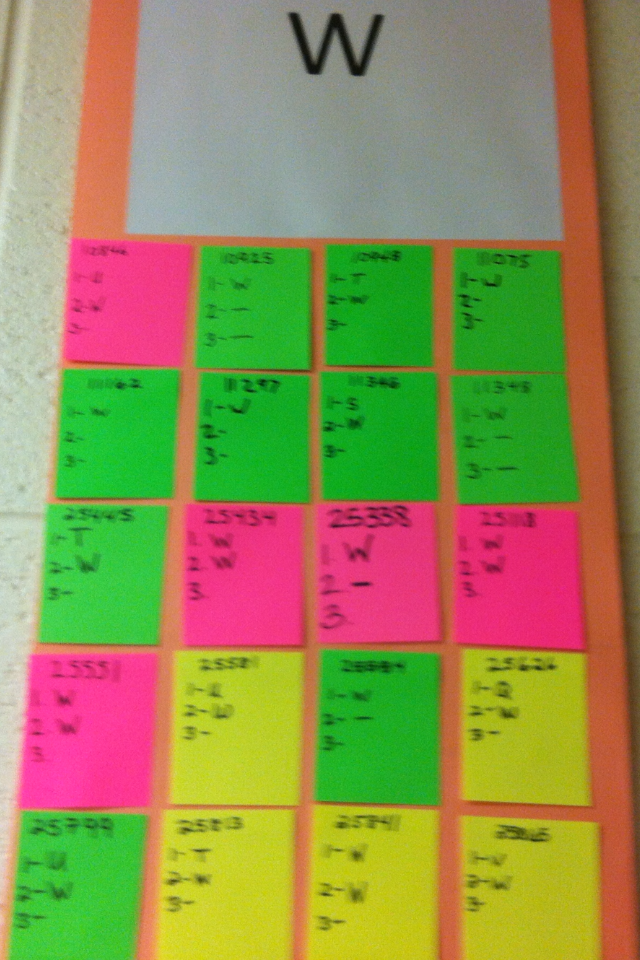
Each student notecard contains the student’s ID number, their benchmark score from the first, second, and third round on benchmarking, and any stickers to identify students with different circumstances.
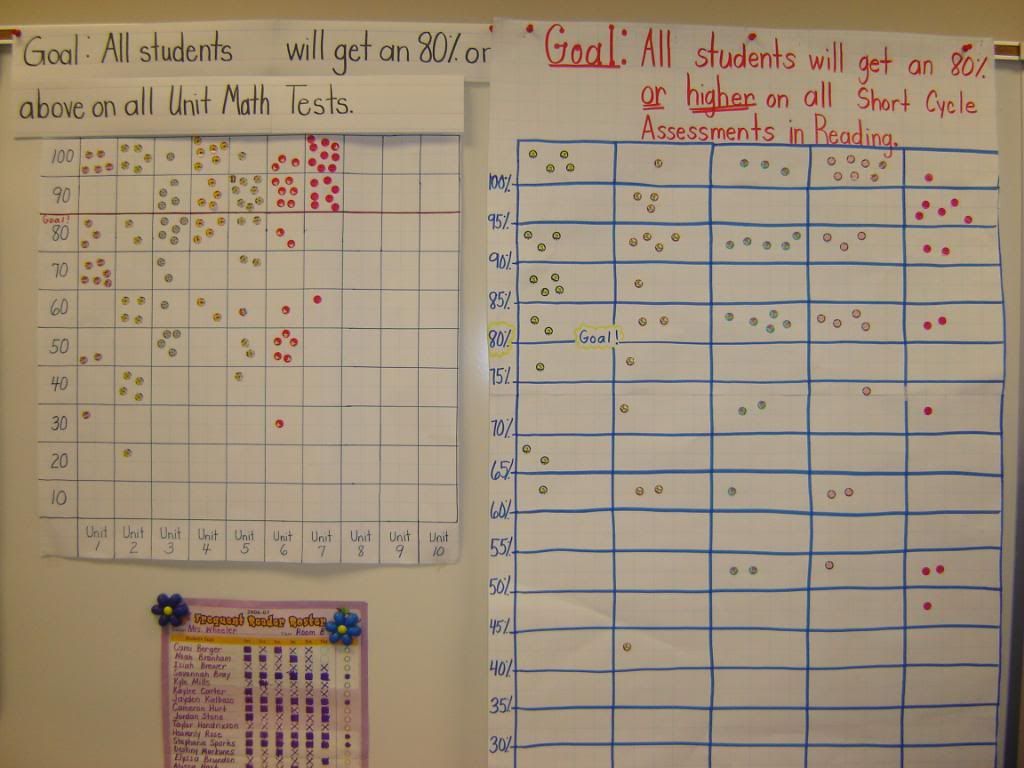
Editor’s Note: Another example of a data wall can be seen below, from photobucket user Megan_Wheeler.
What A Data Wall Looks Like; 2 Data Wall Examples