50 Everyday Formative Assessment Strategies
Formative assessment strategies matter. Like a chef checks a dish for taste, teachers must make frequent, targeted checks for understanding.


Formative assessment strategies matter. Like a chef checks a dish for taste, teachers must make frequent, targeted checks for understanding.
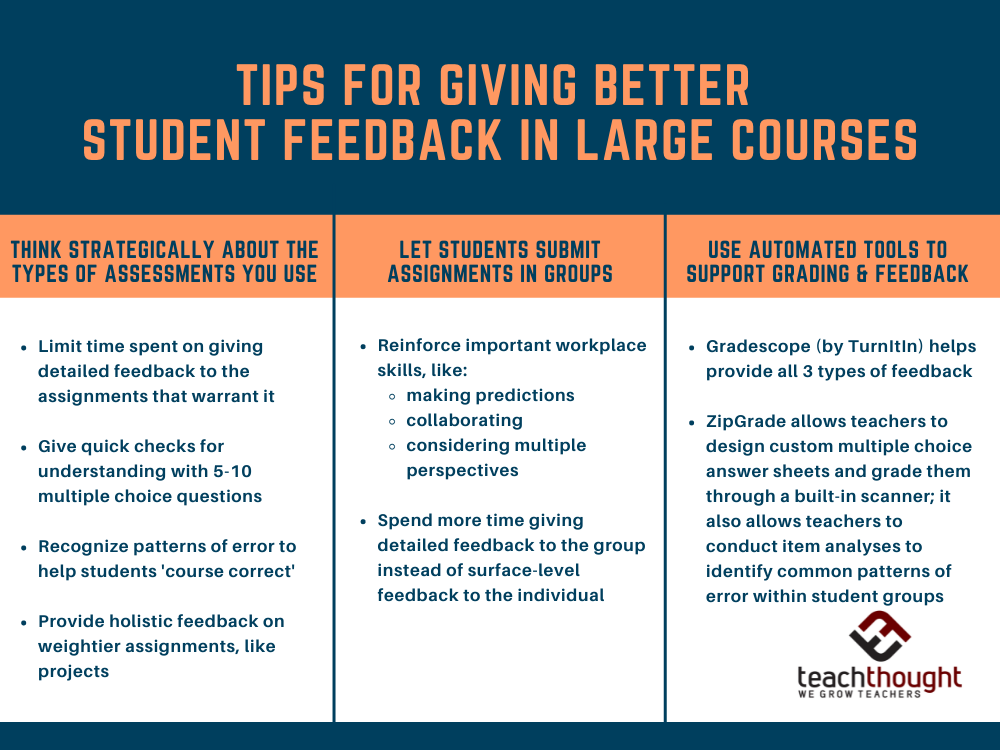
Although giving better student feedback in a large classroom can be challenging, it’s possible to do so without sacrificing substance.
The genesis of a great project is the idea itself — we’re providing you with 50 smart ideas for project-based learning in your classroom.
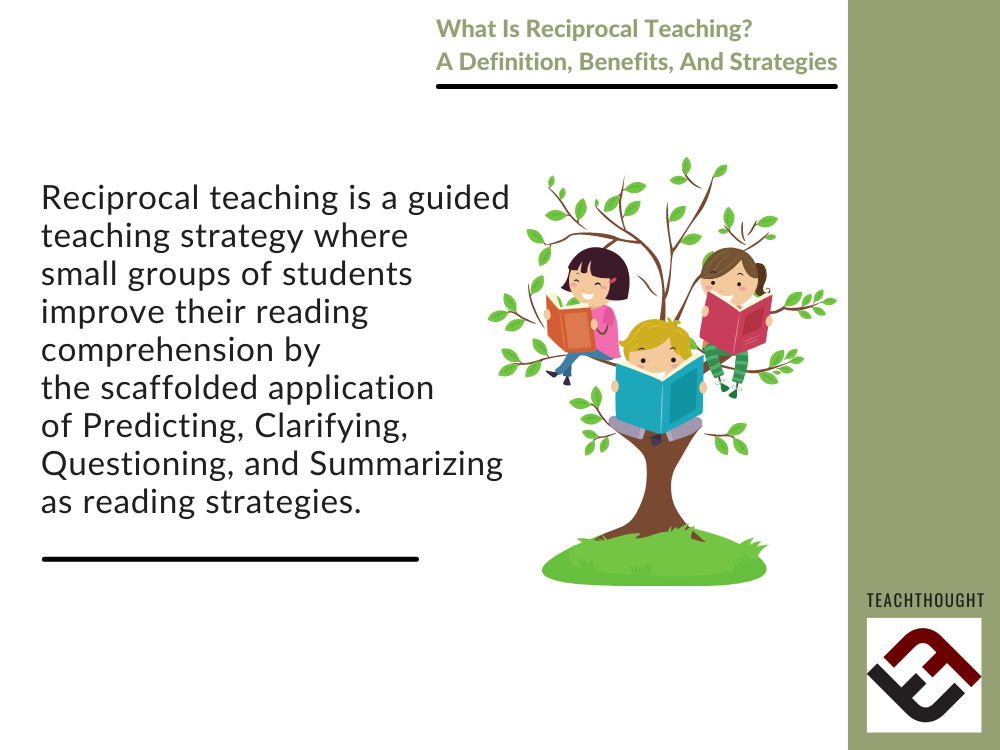
Reciprocal teaching is a teacher-guided strategy where small groups of students play specific roles in the comprehension of a text.
This list of the best SEL resources for teachers and students include apps, prompts, activities, lessons, and more.
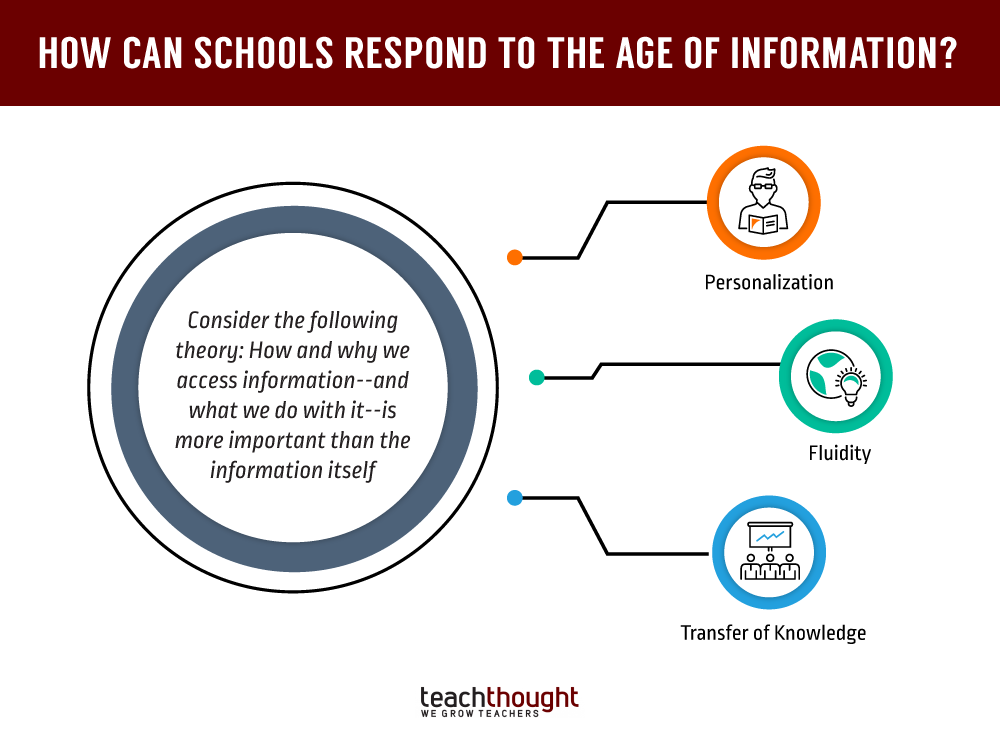
In the Age of Information, data has moved from singular places (here and there) to infinitely plural realities.
Here are 22 simple assessment strategies and tips to help you become more frequent in your teaching, planning, and curriculum design.

Anxiety is feeling like your skin is coursing with electricity, which creates this kind of heat over your skin. It smothers you.
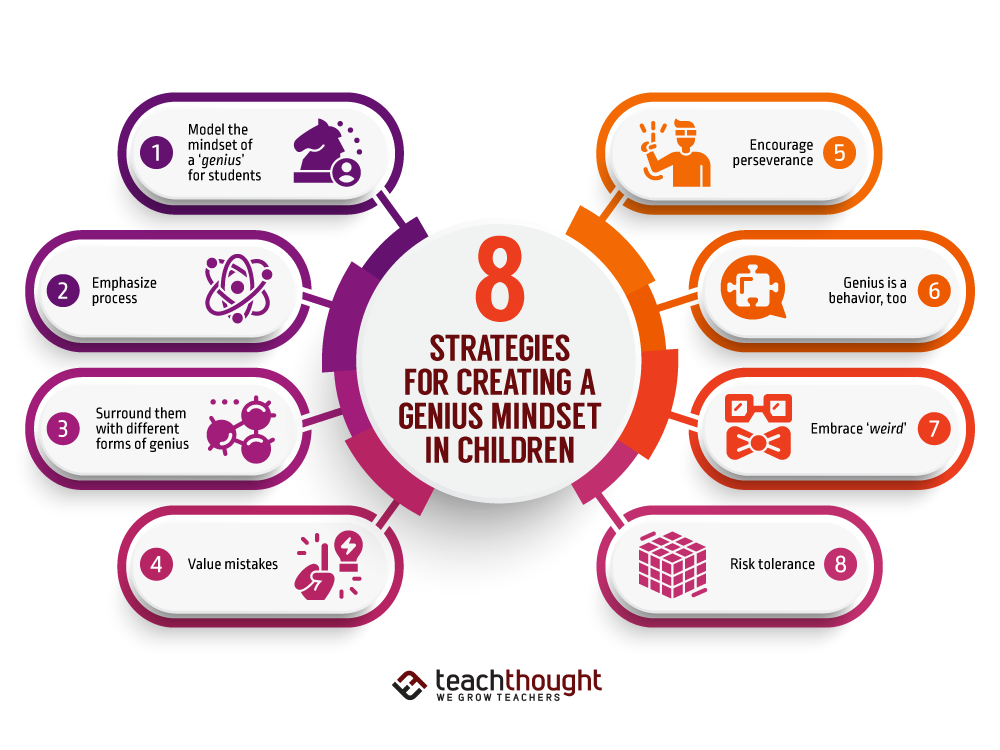
Genius requires one to reject convention in pursuit of something special through a mix of intelligence, creativity, mindset, and perseverance.
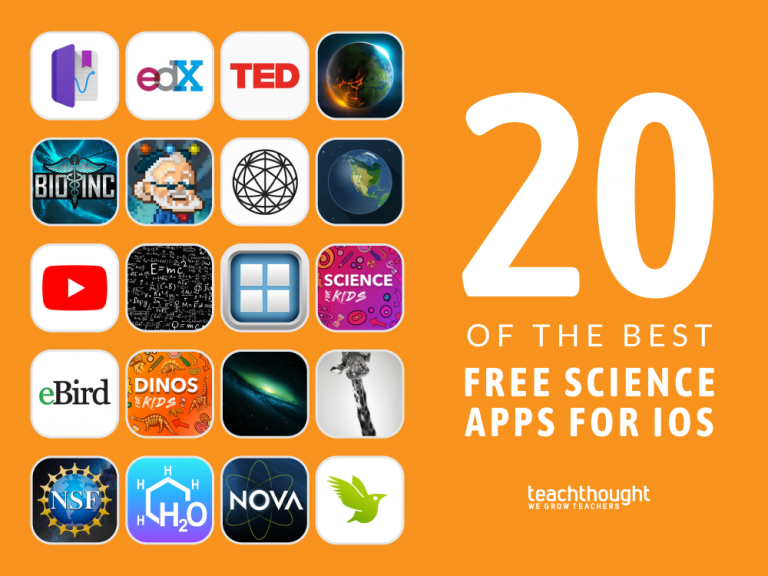
From Google Science Journal to Biomes Viewer, we’ve gathered the best free science apps for iOS.
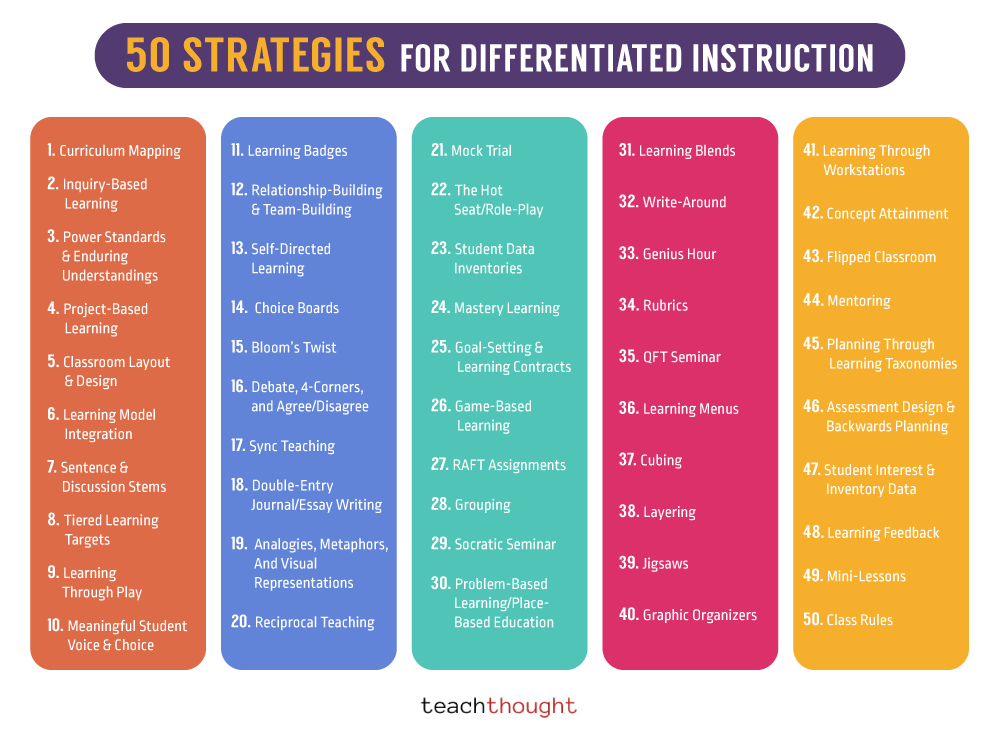
Differentiation is a rational approach to meeting the needs of students but actually making it happen in the classroom can be a challenge.
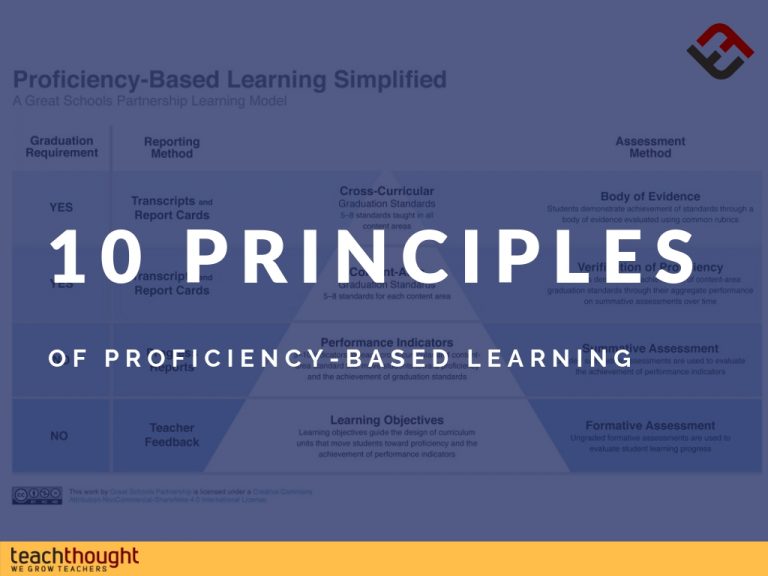
Our principles of proficiency-based learning support achievement evaluated against learning objectives pursued through flexible pathways.
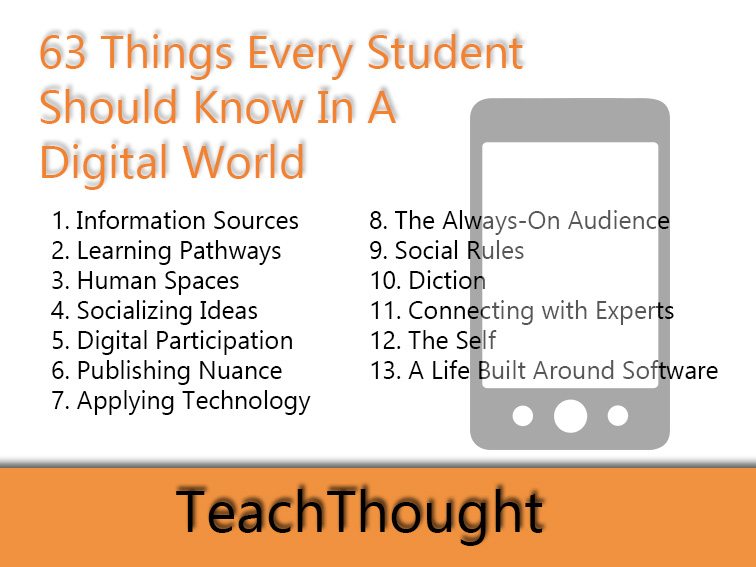
In an increasingly digital world, the things a student needs to know are indeed changing–sometimes drastically.
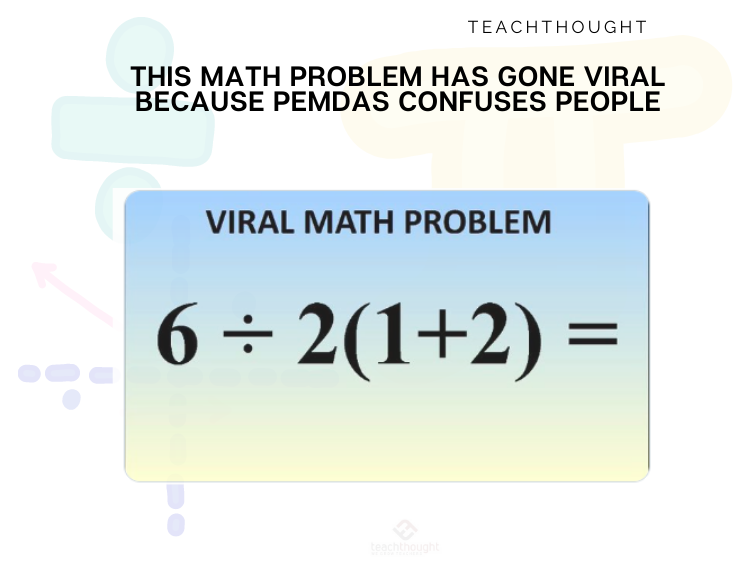
Regardless of what our elementary school teacher told us, we can’t assume that the problem’s author intended us to work from left to right.